Mine the data
Agri-finance investment trends 2001-2021
2001-2017
We have assembled a data bank on agricultural investment data that draws on data provided by the OIO (and its predecessor), as well as by the NGO CAFCA. We partly ground-truthed this data by analysing media reports and investor websites. This allows us to develop a comprehensive and granular picture of the socialites, spatialities, and temporalities of agri-investment flows into the “Kiwi countryside” from 2001-2021, something unique in the world of agri-investment research! The data from 2001 to 2017 was mainly based on the work of Tobias Klinge, University of Leuven, whose pioneering work has been published here. With his help, we have continued the data collection and analysis for the further period until 2021. We take a broader view on agri-investments than normally taken in the land rush/grab literature. Thus, we deliberately also count cases where e.g., a milk processing plant plus the land surrounding it was acquired by a foreign investor, as well as cases of forestry investment. This allows us to arrive at a more comprehensive understanding of how many nature-based resources and productive capacities have moved to foreign ownership. We also include carbon forestry as a potential domain of investment in our sample because of the New Zealand government’s afforestation policy after decades of promoting agricultural production.
Our data contains all transactions on agriculture and forestry with at least 25 percent foreign equity being involved. This includes transactions where farmland has been directly inquired, but it also involves investments into processing facilities which usually come along with a parcel of property, too (e.g., a milk factory with some land). This is important to note: While farmland and forestry contribute significantly to hectare sizes transacted, investments into (processing) facilities make up a good deal of the NZ$ amount transacted. For more information about our methods, click here.
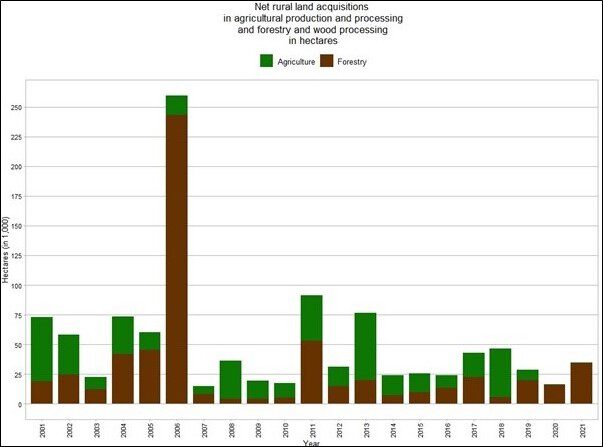
 Net rural land acquisitions between 2001 and 2021. Source: Own elaborations 2022.
 You can mine the data in the Shiny-App below, but as a summary, we can arrive at the following conclusion:
- With the financial and food price crises in 2007 and 2008, global interest in Aotearoa New Zealand farmland has been rising (counted in hectares). This interest culminated in 2013. Since then, investments in farmland came down and then climbed up again in 2018. As you can see in the Shiny-App, the trend for invested NZ$ looks differently because money has also flown into domains other than land-based production, which can come with significant price tags compared to a classic farm investment (e.g., a milk-processing factory).
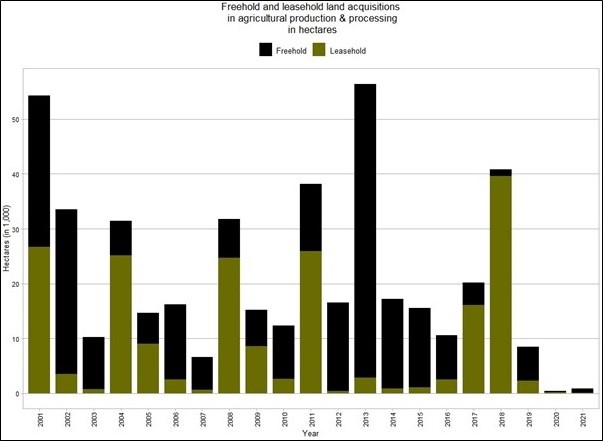
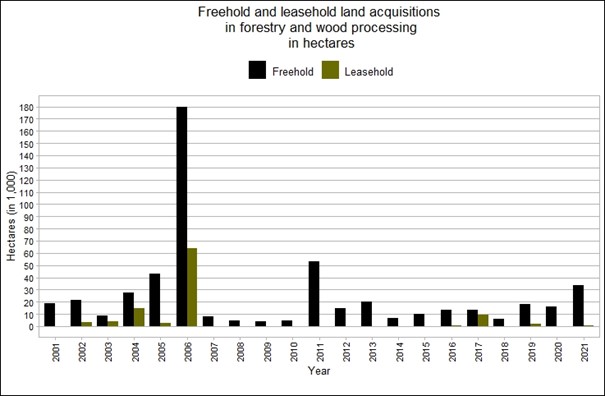
- Between 2001 and 2021 a total of 1.078.117 hectares (net) of rural land (forestry and farmland) changed hands (from New Zealand owners to foreign owners), accounting for about 10 percent of Aotearoa New Zealand’s productive land (10.467.000 hectares)[1]. Speaking for farmland only, this means: Between 2001 and 2021 255 603 hectares of freehold land and 196 021 hectares of leasehold land (all net) were transferred to foreign investors from Aotearoa New Zealand parties, with 42% of all freehold land (108 602 hectares) transferred between 2011 and 2016 and 30% of all leasehold land (57 955 hectares) transferred between 2017 and 2018[2]. This trend of decreasing net acquisitions of freehold land and relatively increasing net acquisitions of leasehold land, as well as the overall scarcity of acquisitions of agricultural production and processing from 2019 onwards, could be explained by shifts in policy when the Labour Party came to power in 2017. This appears to differ from previous political regimes due to the introduction of stricter environmental requirements and the preference for transactions in the forestry subsector, if at all. Between 2001 and 2021, a total of 525 694 hectares of forestry freehold land were transferred from New Zealand owners to foreign investors. Although only 16% (87 038 hectares) of all forestry and wood processing ownership land has been transferred since the Labour government came to power in 2017, this latest figure represents a 42% share within the last decade. This increasing trend shows a certain demand for this sector, possibly fuelled by carbon credit trading.
- The Shiny-App also shows that from 2008 to 2013 onwards institutional agri-investments increased steadily (counted by the hectares; again, the trend manifests itself somewhat differently for invested NZ$, as already explained above). However, in 2014/2015 dairy prices collapsed due to an overproduction in the world’s key regions, which led to a fall in land prices. Around the same time, the public discourse in the country increasingly questioned the environmental footprint of dairy. Because of an insecure and changing regulatory environment (a new government coalition made up of the Labour, Green, and nationalist NZ First party came to power in 2017), investors adjusted their strategies (e.g., moving towards organic farming), withdrew their applications from the OIO or increasingly started to invest in carbon forestry in 2019, for which the new government provided incentives.
- Contrary to what much of the land rush literature claims, as well as the public (national) debate on foreign investments, the greater part of investors eyeing at farming ventures (and forestry) are neither situated in Asia nor in the Gulf states. Our research reveals that most investments have their origins in Europe and North America.
- Two trends are characterizing the targeted sectors of overseas investment: Sheep and beef, traditionally less risky investments and less capital-intensive, remain quite attractive. At the same time, this sector is in decline since the 1980s. Many indebted sheep or beef farms have been converted into dairy farms as part of the white gold rush. The white gold fever has significantly reshaped the environmental landscape in many parts of the North and South Island. It has partly been enabled by conversion-friendly legislation, e.g., the generous allocation of watering rights to facilitate the perennial irrigation of pasture in the Canterbury Plains.
- For other excellent details on agri-investments in Aotearoa New Zealand, including details on the largest buyers of farmland, see the work of Klinge (2020). However, the piece is still based on an older dataset that does not extend into 2021 and may contain a few other gaps because of data withheld at the time of research.
(Ouma 2020: 79-82)

[1] The World Bank (2018) Agricultural land (sq. km.) New Zealand.
Available at: https://data.worldbank.org/indicator/AG.LND.AGRI.K2?locations=NZ (accessed 3 August 2022).
[2] Note that we also accounted for agricultural or forestry assets that have been transferred more than once and may thus inflate numbers. We could only do so for data that was fully georeferencable, which
only applies to the data collected between 2006 and 2021 (n= 1343).
Cases which were sold more than once amounted to 6.4% (n=84) of
all transactions recorded during this period. We do not provide
accounts of assets that may have been transacted multiple times.
Even if double/multiple counts (including those not captured for
the period 2001-2005) may slightly inflate figures, repeated
transactions in land can still be read as an indicator for the
foreignization of agricultural and forestry land and ventures in
Aotearoa New Zealand.
 Freehold and leasehold land acquisitions in agricultural production and processing. Source: Own elaborations 2022.
  Freehold and leasehold land acquisitions in forestry and wood processing in hectares. Source: Own elaborations 2022.
 Explore the Shiny-App by clicking on it

Please allow for up to 30 seconds of loading time (especially on mobile phones).